Chart Image API
Charts that render anywhere — including email
Email clients can't run JavaScript, so a live dashboard chart dies in the inbox. POST a JSON payload here and get back a finished chart PNG that renders everywhere.
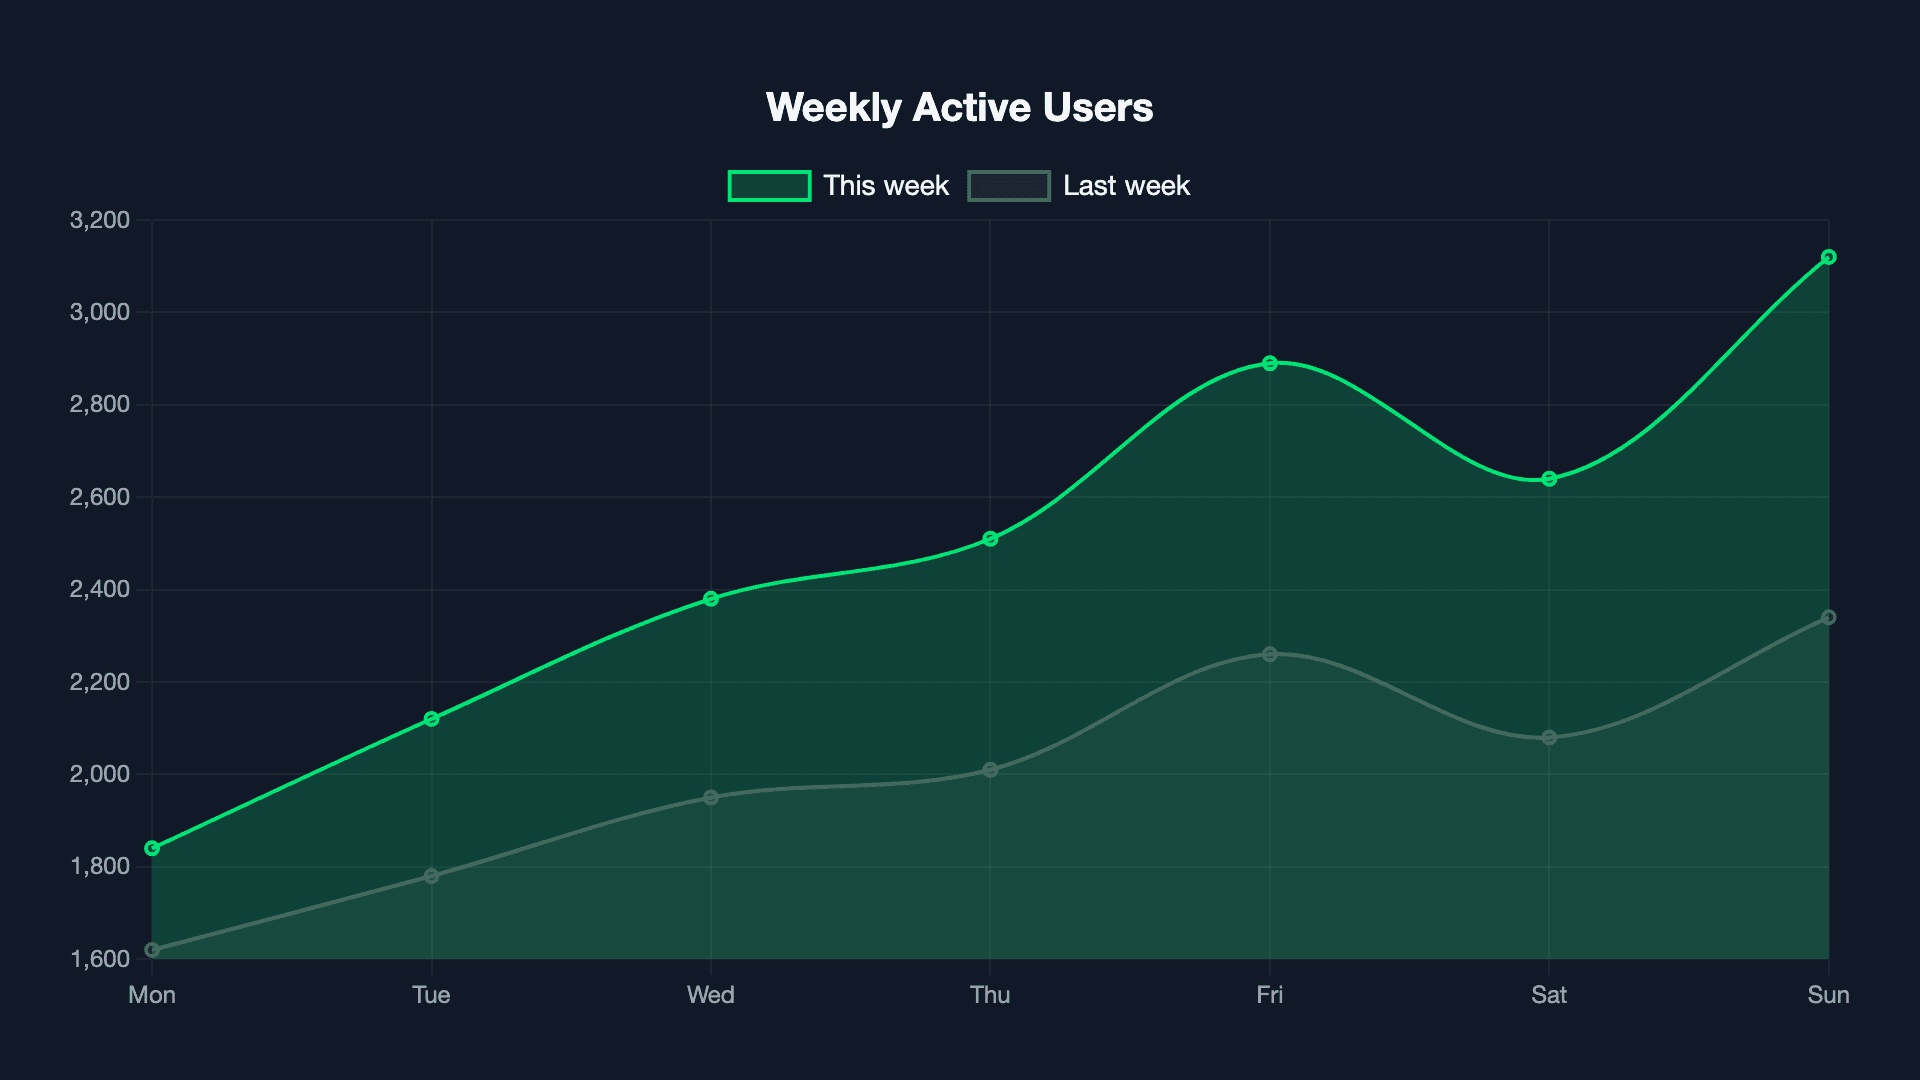
POST /api/v1/render · type: "chart" · format: "png" · line, bar, or pieA static image is a feature, not a limitation
Line, bar, and pie out of the box
Pass a type in the JSON payload and get the matching chart style back, with labels, a legend, and per-dataset colors.
Deterministic, animation-free renders
Charts render synchronously with animation disabled, so identical input always produces identical output pixels — reliable for automated reports.
Works where a live <canvas> can't
Email digests, PDF reports, and chat unfurls all strip or block JavaScript. A rendered PNG works in every one of them.
How it works
- 1
Shape your chart as JSON
Provide a type, labels, and one or more datasets — the same structure you'd already hand to a charting library.
- 2
POST it with type: "chart"
Choose png for an inline image, or pdf to embed the chart in a multi-page report.
curl -X POST https://renderfy.io/api/v1/render \ -H "Authorization: Bearer rfy_live_YOUR_KEY" \ -H "Content-Type: application/json" \ -d '{ "type": "chart", "content": "{\"type\":\"line\",\"labels\":[\"Mon\",\"Tue\",\"Wed\"],\"datasets\":[{\"label\":\"Signups\",\"data\":[12,19,7]}]}", "options": { "format": "png", "dimensions": { "width": 900, "height": 500 } } }' \ --output chart.png - 3
Embed the image anywhere
Drop it into an email template, a static report page, or a chat/webhook notification — no live chart library required on the receiving end.
Frequently asked questions
What chart types are supported?+
Line, bar, and pie — each fully configured through the type field in the JSON payload you send.
Can I actually put this chart inside an email?+
Yes — that's the primary use case. Because it's a static image rather than a live canvas, it renders identically across every email client, including ones that strip JavaScript entirely.
Can I control the color of each dataset?+
Yes. Each dataset in the JSON payload accepts its own color (or colors, for multi-slice charts like pie), so output matches your brand palette.
Can the chart go in a PDF report instead of a standalone image?+
Yes — the same JSON payload renders through the PDF output path as well, so the same chart definition works for both a standalone image and a multi-page report.
More ways to use the API
Put your next chart where JavaScript can't reach
Sign up, mint an API key, and render your first chart image in the next 5 minutes — 100 free credits included — no card needed.